

Along with interest rates rising against inflation, global stock markets have been bearish and obviously continue to drop as inflation kind of hovers over in a higher position and might last for a long period before pushing it down.
Only when the tide goes out do you discover who has been swimming naked. From a standpoint of the cost of buying in the stock market, this is absolutely a good chance to observe the momentum and estimate the time bottoming out. It’s because this timing is easier for us to analyze and identify undervalued companies compared to the previous QE era, notably now companies are confronting the increasing cost of debt and economic recession challenges. Who can stay still, who is the ACE?
If you are an investor in mutual funds, ETFs, trusts, stocks, and so on. This article can help you build a stock symbol data scraper for analyzing financial ratios in bulk using Python and Easy2Digital API.

Pros and cons to make more time by using Stock Symbol Data Scraper
Pros
- Collect and consolidate any symbol data as you like in one place, which saves time to quickly check company news, monitor all of the up-to-date performance, and customize the dashboard to implement financial ratio analysis
- Facilitate to do the common sizing comparison
- It’s free
- FAQ
Cons
- It requires programming knowledge and script maintenance and upgrades
- Activating automation using the cloud might have additional fees although the amount is small and it charges pay-as-to-go normally.
Table of Content
- Easy2Digital Bot – Stock Symbol List API
- Historical and real-time stock price API
- Financial ratio historical and TTM data API
- Valuation multiple
- Liquidity multiple
- Profitability ratio
- Efficiency ratio
- Common sizing comparison
- Full python script of Stock Symbol Data Scraper and Stock symbol data API token
Chapter 28 – Build the Comparable Company Analysis Bot Using Easy2Digital APIs
Easy2Digital Stock Symbol Data API
Each stock has a unique ID in the stock market, which we call Symbol. It’s just like the unique audience ID in digital marketing. If we like to generate the stock and financial data from a specific stock, we need to use the symbol.
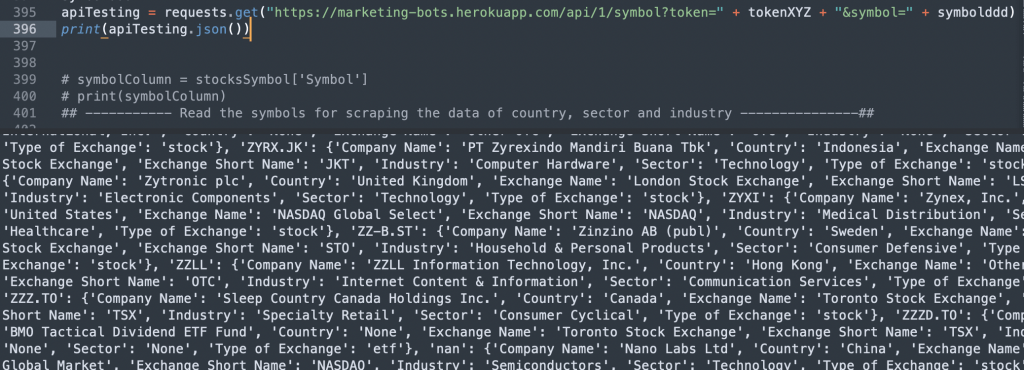
Easy2Digital stock symbol data API provides 44,000+ stock symbol data from different security exchanges worldwide. The data includes the symbol name, company name, industry, sector, and so on. Notably, if you are checking direct and indirect rivals in the same industry and sector, you also need the symbol’s industry and sector data.
Our stock symbol API is free. Please subscribe to our newsletter by leaving a message “Chapter 60”. Then, we will send you the token access to the API asap.
Upcoming instructions use EBAY as an example for stock symbol data scraper
First thing first, I’d like to wrap up the eBay financial analysis. Based on the bottom-up analysis, eBay is being affected by the increasing interest rate notably according to several financial ratio metrics compared to YoY. But compared to direct rivals, eBay must be one of the candidates investors should keep tracking and buy-in for bouncing back from a micro analysis perspective.
Real-time and Historical stock price
Price per share is a crucial data metric because it’s affecting the performance of metric multiples and financial ratio analysis results.

Basically, there are two types of price per-share datasets, which are real-time price and historical price. Real-time price is helpful in technical analysis for trend monitoring and short trade strategy. Conversely, the historical price can help long trade strategy as we can have a bottom-up understanding of a symbol and its underlying and intrinsic value. This is the key bottom-up microanalysis to justify if the symbol is the potential to bounce back after stock collapses in the long-term operation.
Financial ratio TTM and historical data API
Similar to the stock price dataset, the financial ratio dataset also is split into the latest and historical data. TTM is short for trailing 12 months and generally lists companies updating their financials by quarter. Thus, below is an API we can update the up-to-date financial ratio data.
We need to remind the response from the API that requires jsonify. Thus, we need to add a variable the json() to interpret the response dataset.
Valuation multiple
Basically valuation multiple illustrates whether the price is cheap or expensive comparably. From my personal preference, I prefer to use P/B compared to P/E, as the figure is much closer to the net worth of a company. Meanwhile, P/E doesn’t count toward the liability factors, so the risk might be higher even though the price is reasonable. If P/B in a sun-rising industry is sitting at a lower or the lowest point compared to its YoY and its rivals, that’s the candidate we should add to the list.
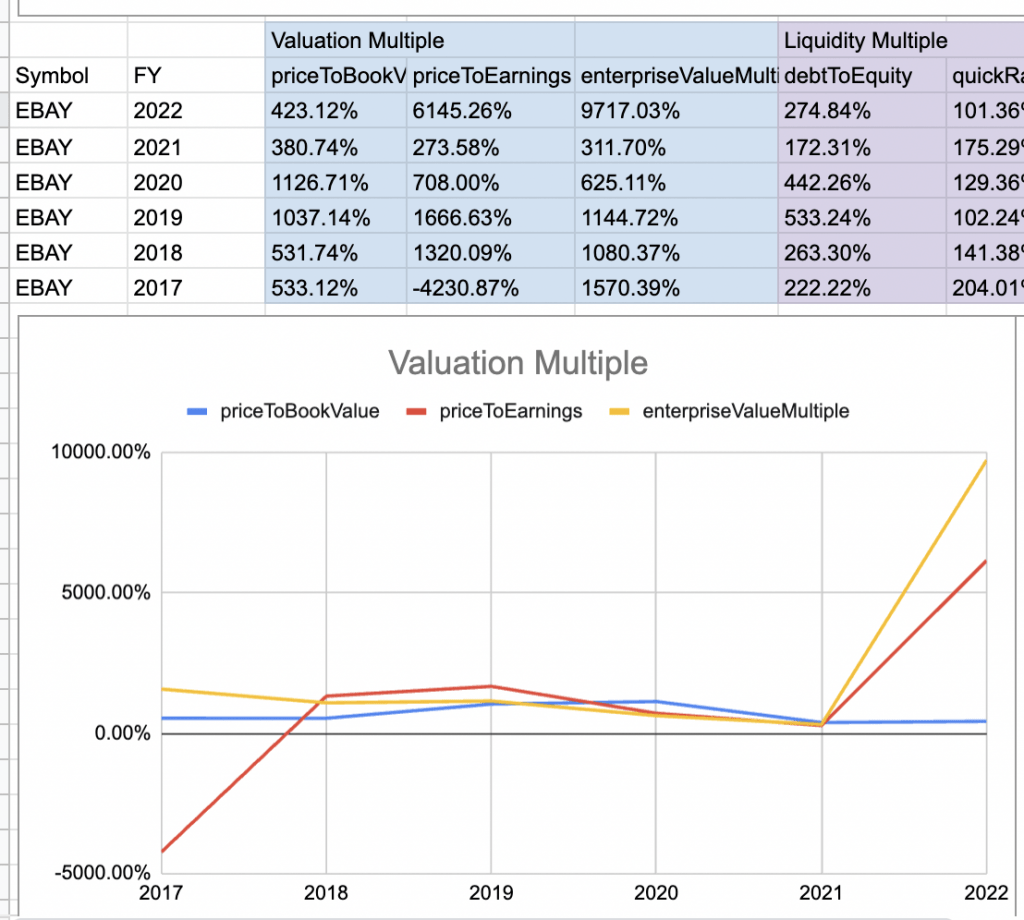
EV/EBITDA is more for acquisition and merger activities. Thus, if a company’s EV/EBITDA is very high and its standalone business model might not be powerful and solid enough to survive in a long-running marathon, that’s the candidate we should add to the list as well. It’s because the company goal might aim for acquisition and merger conducted by a big corp probably
Below is a sample of valuation multiple TTM python codings.
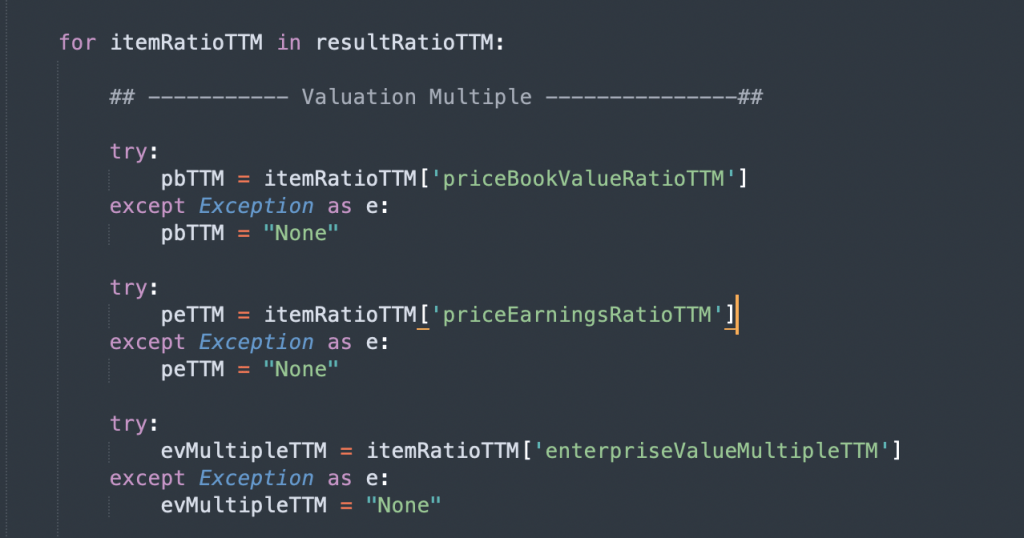
For more details regarding valuation multiples, please check out this article
Valuation Multiples – P/E, P/B, EV/EBITDA Ratio Hints for Marketers
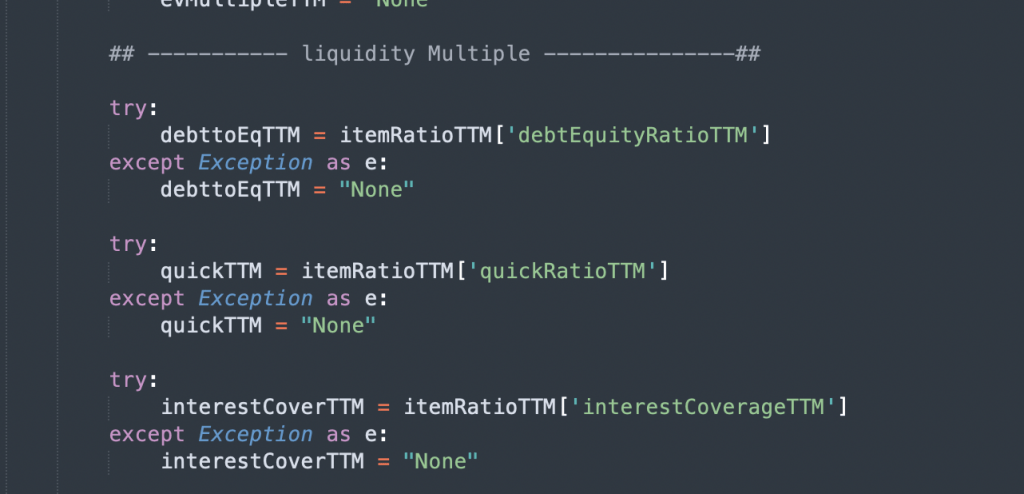
Liquidity multiple
Companies usually have a certain proportion of fundraising from debts. This ratio multiple is crucial to look into because it indicates to investors whether the company might suddenly collapse due to failing on repayment and high-interest expenses. Nobody likes to invest in a company that needs to pay for heavy interest or can’t afford to pay off debts even.
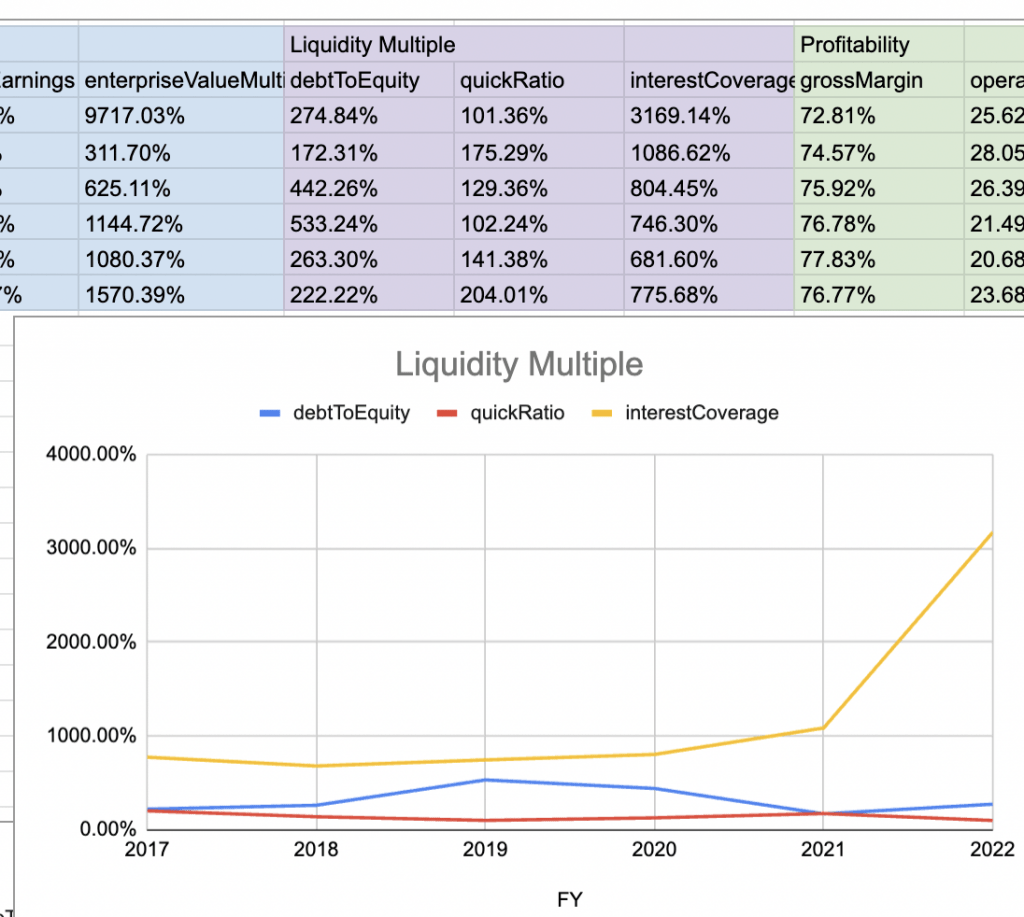
Take EBAY for example, although debt to equity is at a lower point, its interest coverage soars significantly in TTM which obviously is being affected by the USA FEB interest rate going up. That must be affecting the earnings of this symbol and then influence the price per share in the stock market.
Below is the sample of liquidity multiple TTM python codings.
For more details regarding valuation multiples, please check out this article
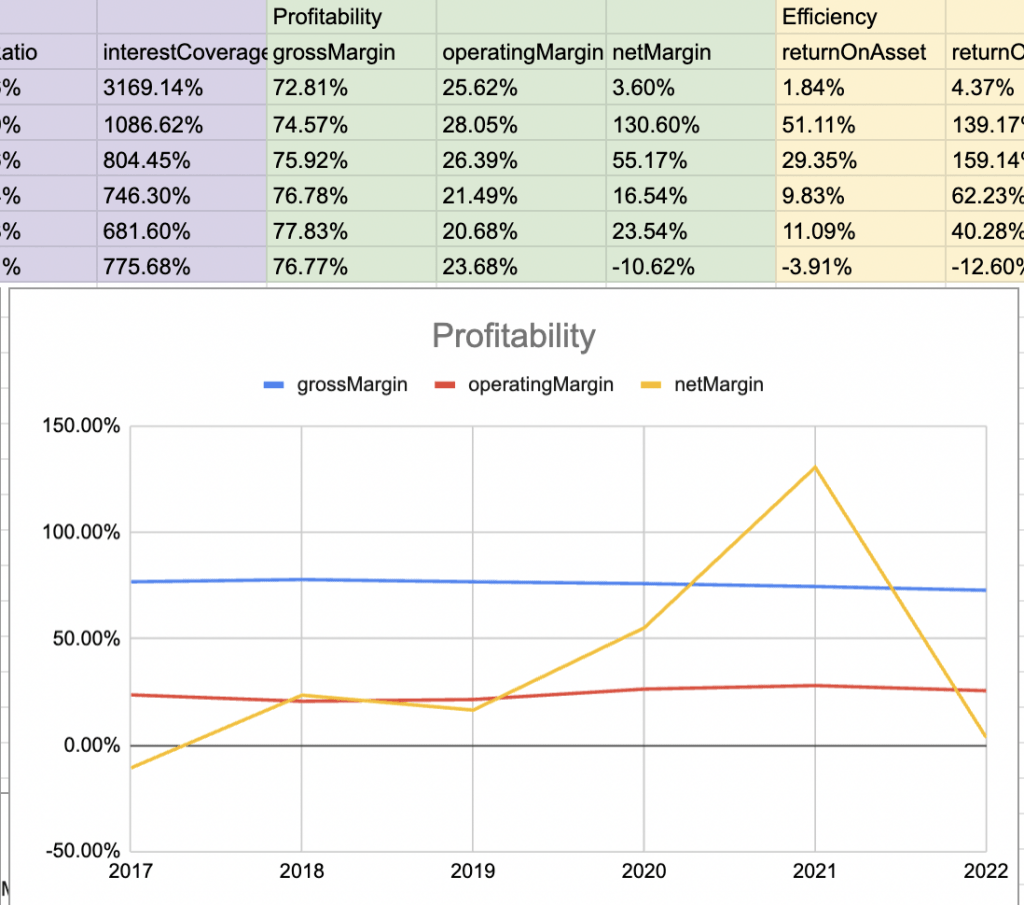
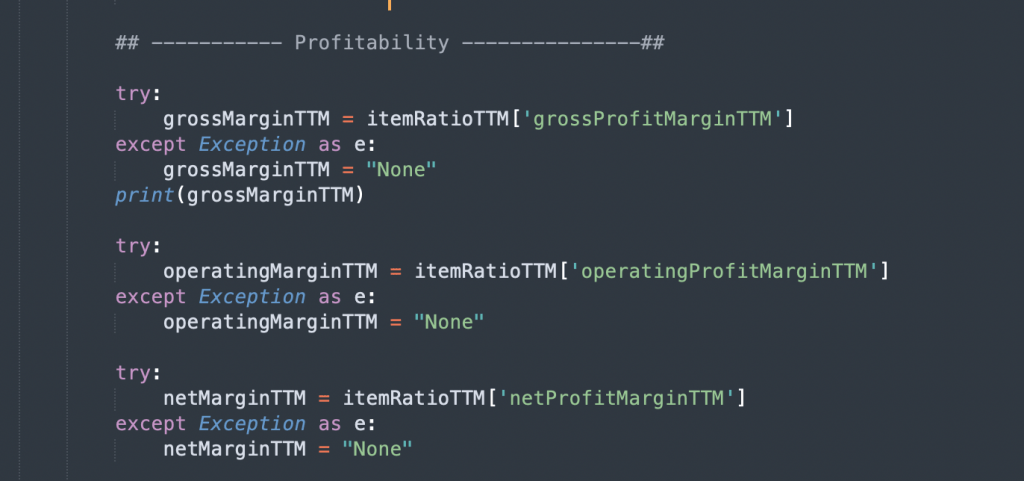
Profitability ratio
As earlier mentioned in another article, my career starts in digital marketing. From my experience, gross margin and operating margin in a way are manipulated, because the variable cost can be optimizable along with the sale’s upward or downward trend, or the sourcing cost change. However, net margin is difficult to be manipulated because as a listed company, liability with more uncontrollable factors can affect the cash flow.
Below is the sample of profitability ratio TTM python codings.
For more details regarding valuation multiples, please check out this article
Profitability Ratio – Gross Margin, EBITDA Margin, Net Margin Hints for Marketers and Investors
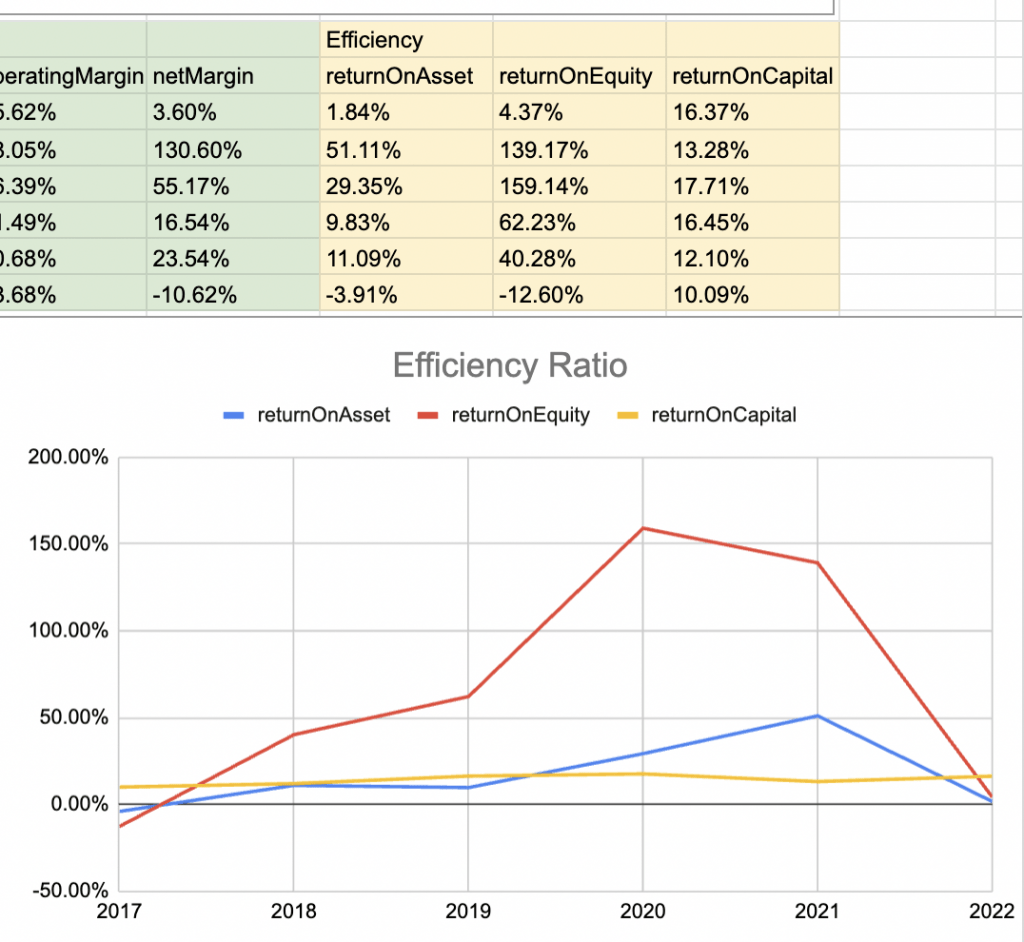
Efficiency ratio
With the net income plummeting, return on asset and return on equity both drop severely in TTM. Luckily, the return on capital looks flat and hovers over 15% approximately compared to YoY. That might imply the overall business operation is healthy and profitable.
Below is the sample of efficiency ratio TTM python codings.
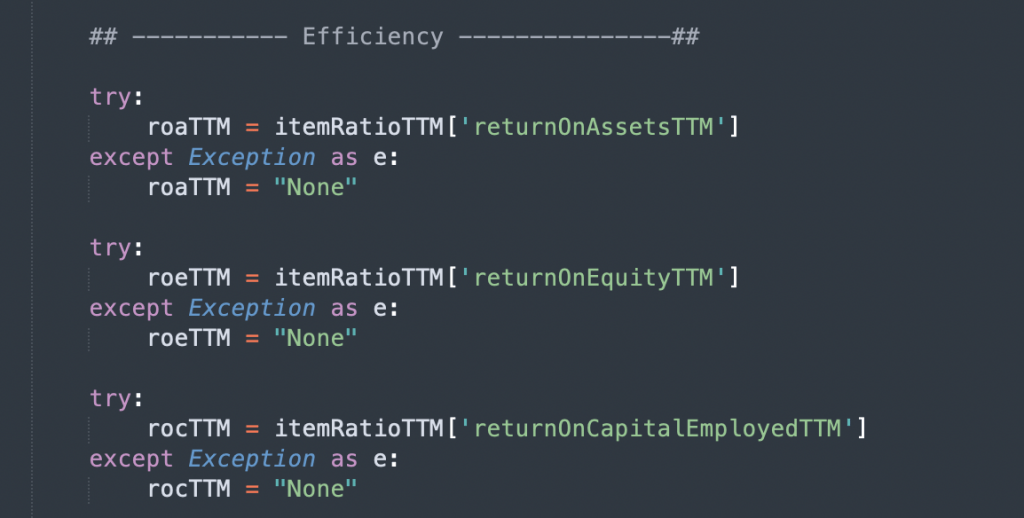
For more details regarding valuation multiples, please check out this article
ROA, ROE, ROC – Hints for Investors and Marketers from Financial Ratio Analysis
Common sizing comparison
Common sizing comparison is critical in financial ratio analysis because a company is living in an industry under a sector. What that standalone performance means from a single company is related to the whole industry it is sitting in.
Amazon and ETSY are eBay’s direct rivals. In terms of P/B for example compared to both, obviously, eBay’s P/B, as well as Amazon, shrink along with the cost of debt arising thanks to the USA Feb recent monetary policy against inflation.
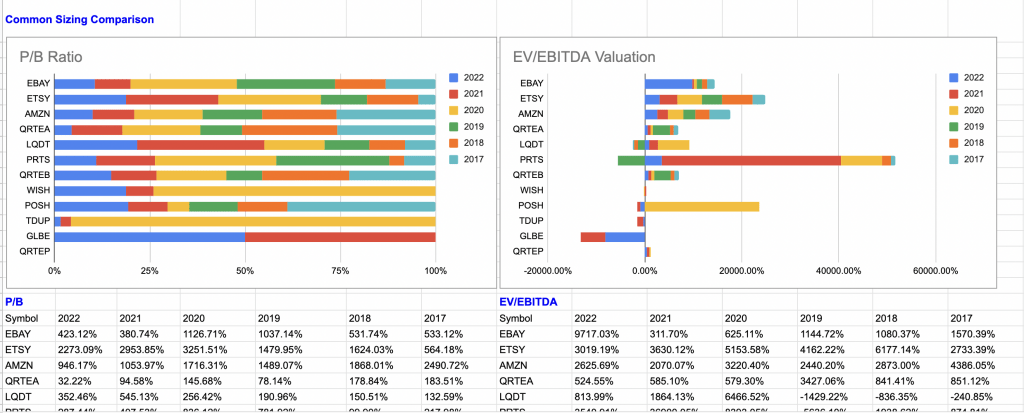
However, shrinking for new investors might be good news as the chart depicts that once the policy returns downward, we can buy in at a lower price and obtain tasty capital gains
Full python script of Stock Symbol Data Scraper and Stock symbol data API token
If you are interested in the full Python script of Chapter 60 – Stock Symbol Data Scraper for Financial Ratio Analysis, please subscribe to our newsletter by adding the message “Chapter 60”. We would send you the script immediately to your mailbox.
I hope you enjoy reading Chapter 60 – Stock Symbol Data Scraper for Financial Ratio Analysis. If you did, please support us by doing one of the things listed below, because it always helps out our channel.
- Support and donate to our channel through PayPal (paypal.me/Easy2digital)
- Subscribe to my channel and turn on the notification bell Easy2Digital Youtube channel.
- Follow and like my page Easy2Digital Facebook page
- Share the article on your social network with the hashtag #easy2digital
- Buy products with Easy2Digital 10% OFF Discount code (Easy2DigitalNewBuyers2021)
- You sign up for our weekly newsletter to receive Easy2Digital latest articles, videos, and discount codes
- Subscribe to our monthly membership through Patreon to enjoy exclusive benefits (www.patreon.com/louisludigital)
FAQ:
Q1: What is Financial Ratio Analysis?
A: Financial Ratio Analysis is a method used to evaluate the financial health and performance of a company by analyzing its financial statements and calculating various ratios.
Q2: Why is Financial Ratio Analysis important?
A: Financial Ratio Analysis is important as it provides insights into a company’s profitability, liquidity, solvency, and efficiency. It helps investors, creditors, and management make informed decisions.
Q3: What are the different types of financial ratios?
A: There are various types of financial ratios, including liquidity ratios, profitability ratios, solvency ratios, efficiency ratios, and market ratios.
Q4: How are liquidity ratios calculated?
A: Liquidity ratios measure a company’s ability to meet short-term obligations. Common liquidity ratios include the current ratio, quick ratio, and cash ratio.
Q5: What do profitability ratios indicate?
A: Profitability ratios measure a company’s ability to generate profits. Examples of profitability ratios include gross profit margin, net profit margin, return on assets (ROA), and return on equity (ROE).
Q6: What do solvency ratios measure?
A: Solvency ratios assess a company’s ability to meet long-term debt obligations. Debt-to-equity ratio, interest coverage ratio, and debt ratio are examples of solvency ratios.
Q7: What do efficiency ratios evaluate?
A: Efficiency ratios evaluate how effectively a company utilizes its resources. Common efficiency ratios include inventory turnover ratio, asset turnover ratio, and accounts receivable turnover ratio.
Q8: How are market ratios calculated?
A: Market ratios reflect a company’s market value and investor sentiment. Examples of market ratios include price-to-earnings (P/E) ratio, earnings per share (EPS), and dividend yield.
Q9: What are the limitations of Financial Ratio Analysis?
A: Financial Ratio Analysis has limitations as it only provides a snapshot of the company’s financial health and performance. It does not consider external factors, industry benchmarks, or qualitative aspects.
Q10: How often should Financial Ratio Analysis be conducted?
A: Financial Ratio Analysis should be conducted regularly, typically on a quarterly or annual basis, to track the company’s financial performance over time and identify trends.