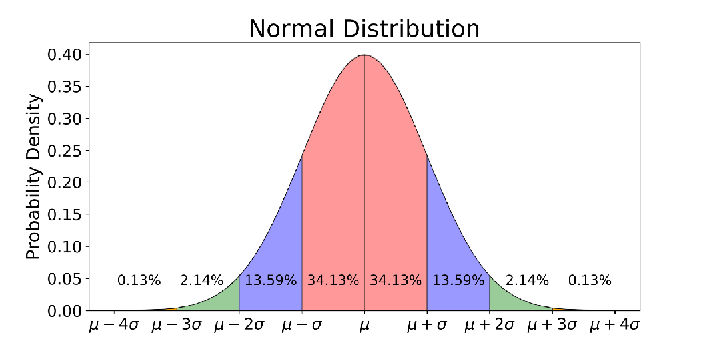
A normal distribution is a continuous probability distribution that is symmetric around the mean, with a bell-shaped curve. The normal distribution is often used to model real-world data, such as human height or test scores.
A normal distribution is a continuous probability distribution that is symmetric around the mean, with a bell-shaped curve. The standard normal distribution is a special case of the normal distribution with a mean of 0 and a standard deviation of 1.
The probability density function of a normal distribution is given by the following equation: F(x) . = (1 / (σ√(2π))) * exp(-((x – μ)² / (2σ²))) where: μ is the mean of the distribution σ is the standard deviation of the distribution x is a value in the distribution
The cumulative distribution function of a normal distribution is given by the following equation: F(x) = (1 / 2) * (1 + erf((x – μ) / (σ√2))) where: μ is the mean of the distribution σ is the standard deviation of the distribution x is a value in the distribution erf is the error function
The mean of a normal distribution is the average value of the distribution. The mean is equal to the sum of all the values in the distribution divided by the number of values in the distribution.
The standard deviation of a normal distribution is a measure of how spread out the distribution is. The standard deviation is equal to the square root of the variance of the distribution.
The variance of a normal distribution is a measure of how spread out the distribution is. The variance is equal to the average of the squared differences between each value in the distribution and the mean.
You can generate a normal distribution in Python using the `numpy.random.normal()` function. The `numpy.random.normal()` function takes two arguments: the mean of the distribution and the standard deviation of the distribution.
You can plot a normal distribution in Python using the `matplotlib.pyplot.plot()` function. The `matplotlib.pyplot.plot()` function takes two arguments: the x-values and the y-values. The x-values should be the values in the distribution and the y-values should be the probability density function of the distribution.
The normal distribution is used in a wide variety of applications, including: * Modeling real-world data * Hypothesis testing * Confidence intervals * Forecasting * Risk assessment
Comment & Review
No Comment at the moment...
Cookies & Data Privacy
Our site uses cookies to distinguish you from other users of our website. This helps us to provide you with a good experience when you browse our site and allows us to improve our site. A cookie is a tiny text file that is saved onto your computer, smartphone, tablet or other web-enabled device when you visit our site. You can choose to accept or reject all cookies, as these are used to support the core functionality of our website.
EASY2DIGITAL.com is 100% compliant with the GDPR, CCPA. To learn more about how we collect, keep, and process your private information in compliance with GDPR and CCPA, please view our privacy policy.