Generate Feature Importance Using Scikit learn, Random Forest
Learn a basic concept to use Random forest applied to your projects and compare the result amongst different methods

Learn a basic concept to use Random forest applied to your projects and compare the result amongst different methods

Take the financial ratio TTM API as an example. Build a Google Sheet function to sync specific financial ratio data and update automatically

In this Python knowledge hub, I would make a JSON vs YAML, and elaborate what are their pros and cons respectively, and how to better use.
In this Python CSV module, you can master what CSV read, parse and write methods you can use to open and save CSV files in a readable format
This Chapter walks you through how to leverage Easy2Digital APIs, and Google Sheets APIs, to manipulate data in Google Sheets

Ingredients to create a brand info bot leveraging Easy2Digital API scrape the specific web URLs at scale, learn more.
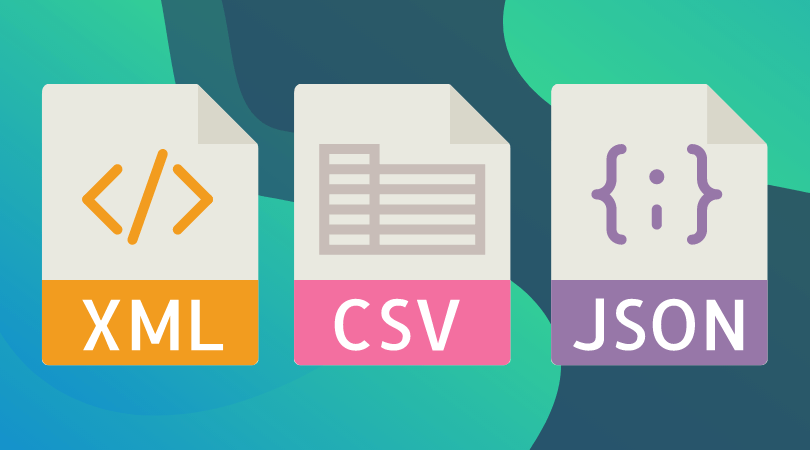
Learn how to create a script that can convert CSV, SQL, or Google Sheets data into JSON or XML. The modules to be used are the JSON and CSV

You can build a data converter converting CSV or Google Sheet data into SQL. Also it also instructs you how to turn SQL data back to them.

In this article, I would walk you through how to visualize ticker stock daily pricing and volume using yFinance, mplfinance and Pandas

Previously I shared the way to visualise daily pricing in a candle type data format, here I would walk through how to visualise a collection of stock portfolio in a time series data format.
This article shares how to convert a column into a row using Set_index().T given by Pandas and Python, learn and get the script.

In this piece, I would walk you through brieflyf how to predict a variant pricing based on having considered multiple variables that might be correlated to the pricing change. By the end of this piece

Determination is likely being affected by one variant to one variable, or one variant to multiple variables. Machine makes decision based on maths. So in this article, I would walk through how to gene